Building an Interactive Dashboard to Visualize Polish Zloty Performance with RapidMiner
Building an Interactive Dashboard to Visualize Polish Zloty Performance with RapidMiner
In today's fast-paced financial landscape, the ability to visualize currency performance in real-time is crucial for traders, analysts, and developers alike. This blog post will guide you through the process of building an interactive dashboard to visualize the performance of the Polish Zloty (PLN) using the Indices-API and RapidMiner. We will explore the capabilities of the Indices-API, integration steps, API call examples, and best practices for effective data presentation.
Understanding the Indices-API
The Indices-API is a powerful tool that provides real-time and historical exchange rate data for various currencies, including the Polish Zloty. This API is designed to empower developers to create next-generation applications that require up-to-date financial data. With its extensive features, the Indices-API can transform how you visualize and analyze currency performance.
Key Features of the Indices-API
The Indices-API offers several endpoints that can be utilized to gather data for your dashboard. Here are some of the key features:
- Latest Rates Endpoint: This endpoint provides real-time exchange rate data, updated every 60 minutes, 10 minutes, or even more frequently depending on your subscription plan. This feature is essential for capturing the most current performance of the Polish Zloty against other currencies.
- Historical Rates Endpoint: Access historical exchange rates for the Polish Zloty dating back to 1999. This data can be invaluable for trend analysis and forecasting.
- Convert Endpoint: Easily convert amounts from PLN to other currencies or vice versa, which is particularly useful for traders dealing in multiple currencies.
- Time-Series Endpoint: Retrieve daily historical rates between two dates of your choice, allowing for in-depth analysis of currency fluctuations over time.
- Fluctuation Endpoint: Track how the Polish Zloty fluctuates on a day-to-day basis, providing insights into market volatility.
- Open/High/Low/Close (OHLC) Price Endpoint: Get detailed OHLC data for the Polish Zloty, which is critical for technical analysis.
Integrating the Indices-API with RapidMiner
To build an interactive dashboard using RapidMiner, you will first need to integrate the Indices-API. Here’s how you can do it:
Step 1: Obtain Your API Key
To access the Indices-API, you must sign up and obtain your unique API key. This key is essential for authenticating your requests. You will include this key in the API base URL as follows:
https://api.indices-api.com/v1/latest?access_key=YOUR_API_KEYStep 2: Set Up RapidMiner
Install RapidMiner Studio if you haven't already. Create a new project and prepare to connect to the Indices-API.
Step 3: Create API Calls in RapidMiner
In RapidMiner, you can use the 'Web Mining' extension to make API calls. Here’s how to set up a call to the Latest Rates Endpoint:
GET https://api.indices-api.com/v1/latest?access_key=YOUR_API_KEYThis call will return the latest exchange rates, including the PLN. You can then parse the JSON response to extract the relevant data for your dashboard.
Step 4: Data Preparation
Once you have the data, use RapidMiner's data preparation tools to clean and format the data. This may include handling missing values, normalizing data, and transforming data types to ensure compatibility with visualization tools.
Step 5: Building the Dashboard
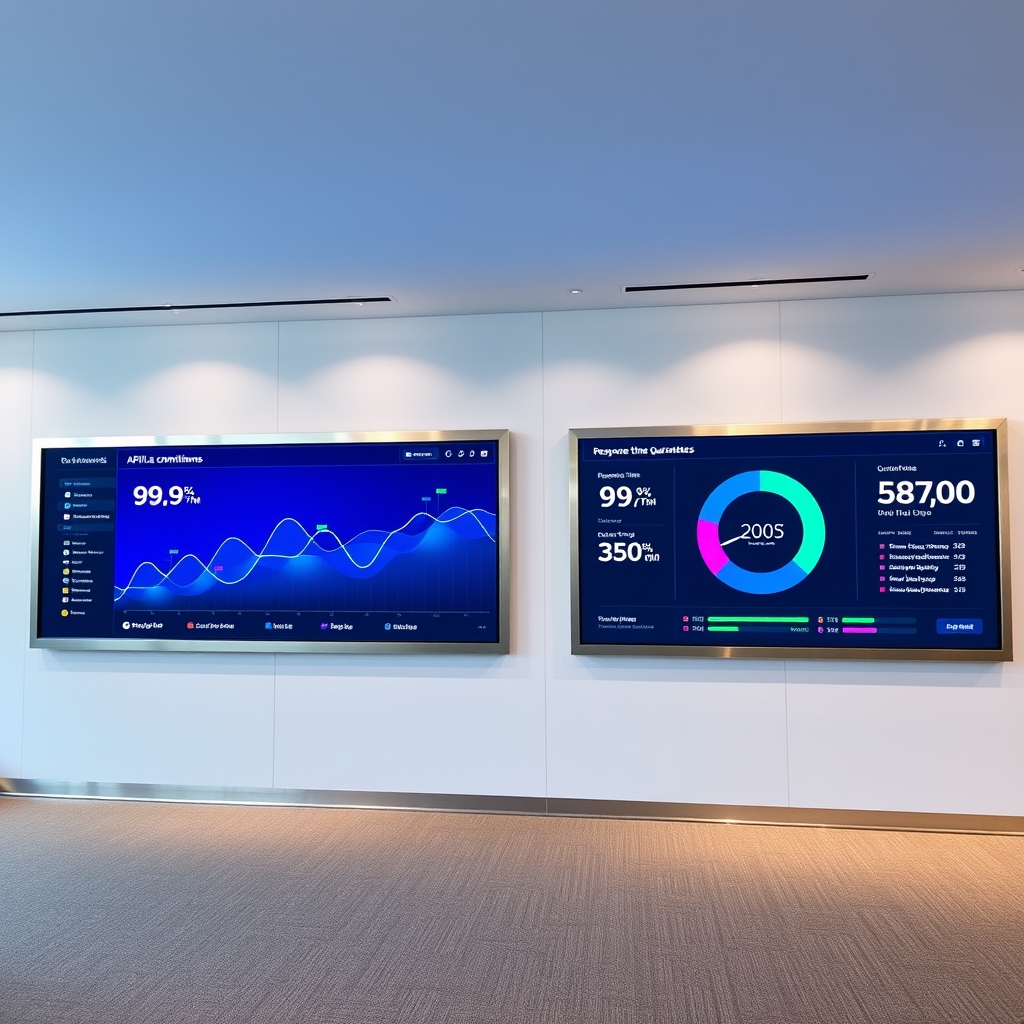
Utilize RapidMiner's visualization capabilities to create charts and graphs that represent the performance of the Polish Zloty. You can create line charts for historical data, bar charts for comparisons, and pie charts for market share analysis.
API Call Examples and Responses
Understanding the structure of API responses is crucial for effective data handling. Here are some examples of API calls and their expected responses:
Latest Rates Endpoint
GET https://api.indices-api.com/v1/latest?access_key=YOUR_API_KEYExample Response:
{
"success": true,
"timestamp": 1769082599,
"base": "USD",
"date": "2026-01-22",
"rates": {
"PLN": 4.00,
"EUR": 0.22,
"USD": 1.00
},
"unit": "per currency"
}
This response indicates that 1 USD equals 4 PLN, which is vital for your dashboard's calculations.
Historical Rates Endpoint
GET https://api.indices-api.com/v1/historical?access_key=YOUR_API_KEY&date=2026-01-21Example Response:
{
"success": true,
"timestamp": 1768996199,
"base": "USD",
"date": "2026-01-21",
"rates": {
"PLN": 4.01,
"EUR": 0.21,
"USD": 1.00
},
"unit": "per currency"
}
This historical data can be used to analyze trends over time.
Time-Series Endpoint
GET https://api.indices-api.com/v1/timeseries?access_key=YOUR_API_KEY&start_date=2026-01-15&end_date=2026-01-22Example Response:
{
"success": true,
"timeseries": true,
"start_date": "2026-01-15",
"end_date": "2026-01-22",
"base": "USD",
"rates": {
"2026-01-15": {"PLN": 4.02},
"2026-01-16": {"PLN": 4.01},
"2026-01-22": {"PLN": 4.00}
},
"unit": "per currency"
}
This endpoint allows you to visualize the PLN's performance over a specified period, making it easier to identify trends and patterns.
Best Practices for Data Presentation
When creating your interactive dashboard, consider the following best practices:
- Clarity: Ensure that all visualizations are clear and easy to understand. Use labels, legends, and tooltips to provide context.
- Consistency: Maintain a consistent color scheme and layout throughout the dashboard to enhance user experience.
- Interactivity: Incorporate interactive elements such as filters and sliders to allow users to customize their view of the data.
- Real-time Updates: Utilize the Latest Rates Endpoint to refresh data in real-time, ensuring that users have access to the most current information.
- Responsive Design: Ensure that the dashboard is responsive and accessible on various devices, including desktops, tablets, and smartphones.
Conclusion
Building an interactive dashboard to visualize the performance of the Polish Zloty using the Indices-API and RapidMiner is a powerful way to leverage real-time financial data. By following the steps outlined in this guide, you can create a comprehensive tool that provides valuable insights into currency performance. Remember to utilize the extensive features of the Indices-API, including the Indices-API Documentation for detailed information on endpoints and capabilities. For a complete list of supported currencies, refer to the Indices-API Supported Symbols. With careful attention to data presentation and user experience, your dashboard can become an essential resource for financial analysis and decision-making.